
System Monitor
silo.system-monitor
Live CPU and memory charts in a side panel and status bar — cross-platform (macOS, Linux, Windows).
System Monitor
A Silo extension that keeps CPU, memory, and per-terminal process activity visible at a glance — without leaving your editor. Works on macOS, Linux, and Windows.
What you get
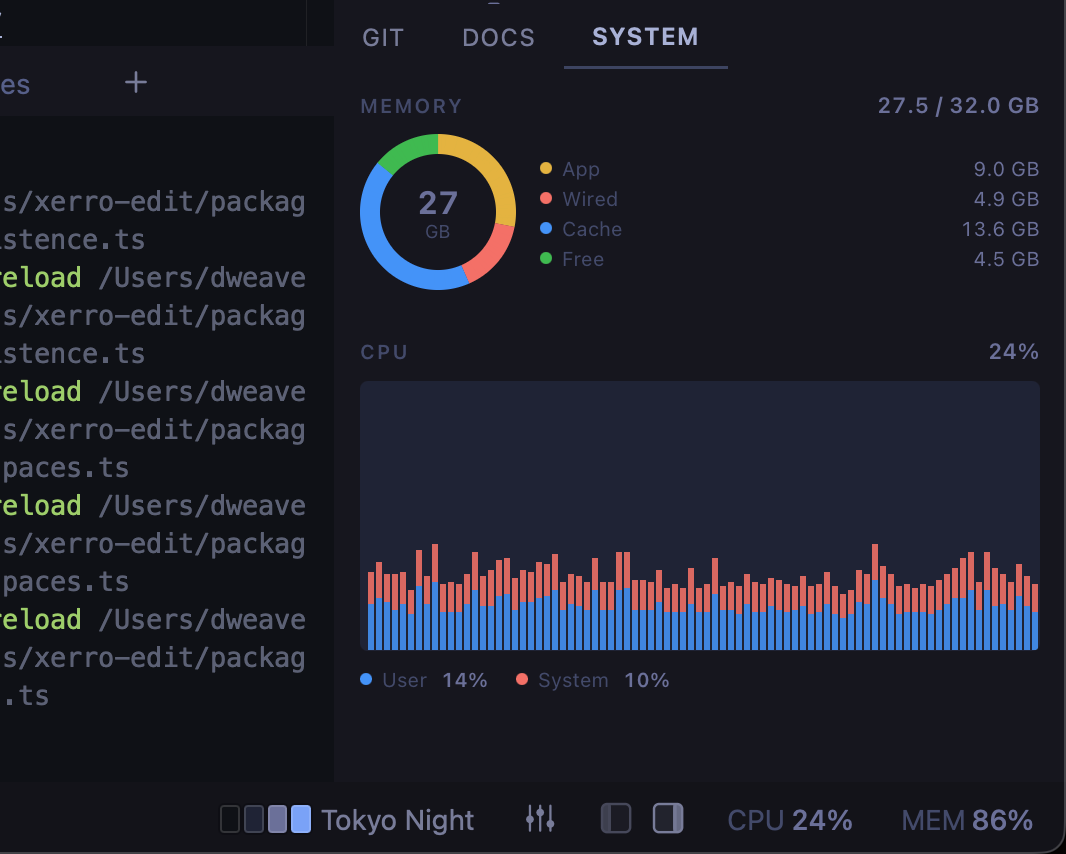
- Side panel — a dedicated SYSTEM tab with a memory donut chart, a scrolling CPU history graph (User vs System split), and a live Processes list for the current workspace
- Status bar readouts — compact live counters at the bottom of the window that stay visible even when the panel is closed; click any chip to open the all-workspaces modal
- All-workspaces process monitor — a Chrome/Windows Task Manager-style modal with live CPU and memory graphs, a filter box, sortable columns, and every terminal session across all workspaces (including soft-closed ones whose PTYs are still running) grouped by workspace (see below)
- Configurable — choose which metrics appear, on which surfaces, and in what order via Settings or the in-panel gear icon
- Persistent settings — your choices are saved across restarts and apply to all workspaces automatically
Processes
The Processes section shows one row per terminal in the active workspace — its foreground program, live CPU/memory (rolled up across its child processes, so a busy build running under a shell doesn't read as idle), and idle/busy state. Expand a row to see the full process tree; click a title to jump to that terminal; hover a row for a one-click kill (with a confirmation) that terminates the process group but leaves the shell itself running.
CPU/memory stats are opt-in and only sampled while the panel is visible and
the section is enabled — closing the panel or disabling it in Settings stops
the extra polling. Process trees (the expand/kill affordances) require ps
and aren't available on Windows; the panel still shows each terminal's
foreground program there.
All-workspaces process monitor
When CPU is climbing and you're not sure which workspace (or whether any workspace) is the cause, click All processes… at the bottom of the side panel, or click any status bar chip, to open the process monitor.
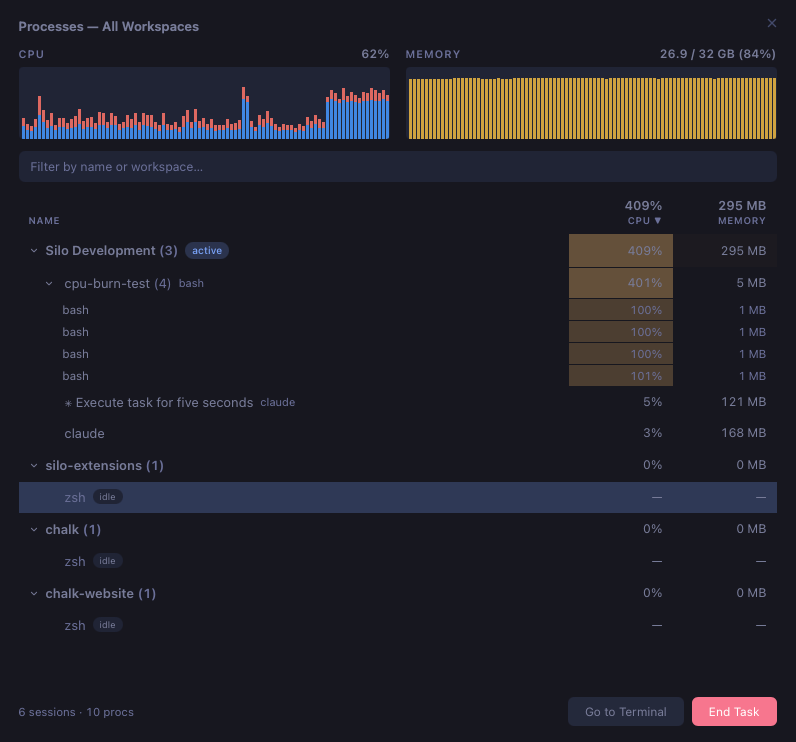
- Live mini graphs — CPU (User + System split, same bar style as the panel) and memory history so you can see the trend at a glance
- Filter — type to narrow by task name or workspace name
- Sortable columns — click Name, CPU, or Memory to re-sort; groups reorder by their aggregate, sessions reorder within each group
- Collapsible workspace groups — sorted hottest-first; each group shows its aggregate CPU/memory with heat tinting that deepens toward your configured danger threshold. Soft-closed workspaces (and members of a closed group) still appear when they have live sessions — closing a workspace keeps its PTYs running until you hard-delete it.
- Selection + actions — click to select a row, then use Go to Terminal (activates the workspace and focuses the terminal) or End Task (kill with confirmation); double-clicking a row also jumps straight to the terminal. Use Hide closed workspaces in the footer to omit soft-closed workspaces; the choice is saved with your settings.
Cross-platform
The extension is a reference implementation for writing platform-aware Silo
extensions. It asks the host which OS it's running on via ctx.system.getInfo()
and selects a matching collector (src/collectors/) — each one a small,
unit-tested module with a pure parser:
| Platform | CPU source | Memory source | Memory donut |
|---|---|---|---|
| macOS | iostat -c |
vm_stat + sysctl hw.memsize |
App / Wired / Cache / Free |
| Linux | /proc/stat (read via ctx.files, no subprocess) |
/proc/meminfo |
Used / Cache / Free |
| Windows | PowerShell Get-Counter |
PowerShell Get-CimInstance |
Used / Free |
The CPU User/System split is preserved on all three platforms. Memory categories
differ per OS, so the donut renders whatever segments the active collector
reports rather than a fixed list. Adding a platform means adding one collector
and a case in selectCollector — the union type from the SDK makes a missing
case a compile error.
Permissions
Declared in package.json under silo.permissions:
process— runiostat/vm_stat/ PowerShell on macOS and Windows.fs:read— read/proc/statand/proc/meminfoon Linux (these live outside the workspace). Reading/procrather than shelling out also avoids subprocess-spawn restrictions under sandboxed Linux packaging.
Installing
From a GitHub Release
- Go to Releases.
- Right-click the
.tgzasset → Copy link address. - In Silo: Settings → Extensions, paste the URL and click Install.
From source
git clone https://github.com/silo-code/silo-extensions
cd silo-extensions/system-monitor
npm install
npm run build
Then in Silo: Settings → Extensions → Install from folder, point at this directory.
Building
npm install
npm run build        # one-shot
npm run build:watch  # watch mode
npm test             # unit tests
Versions
| Version | Published | Permissions | Build | sha256 |
|---|---|---|---|---|
| v0.3.5 | 2026-08-27 | process, fs:read | — | f4da7e685a9b… |
| v0.3.4 | 2026-07-31 | process, fs:read | — | b9617e09e678… |
| v0.3.3 | 2026-07-19 | process, fs:read | — | b7cb1d0c3dfd… |
| v0.3.2 | 2026-07-16 | process, fs:read | — | 4f9c8485133a… |
| v0.3.1 | 2026-07-16 | process, fs:read | — | 1762126e0c69… |
| v0.3.0 | 2026-07-15 | process, fs:read | — | 8e9f21bf10b8… |
| v0.2.8 | 2026-07-15 | process, fs:read | — | ba5a32136625… |
| v0.2.7 | 2026-07-14 | process, fs:read | — | 49d7d418dab9… |
| v0.2.6 | 2026-07-14 | process, fs:read | — | 3a08f0da7e8f… |
| v0.2.5 | 2026-07-13 | process, fs:read | — | ae4e7d14cabc… |
| v0.2.4 | 2026-07-13 | process, fs:read | — | 06598dd53909… |
| v0.2.3 | 2026-07-13 | process, fs:read | — | af294952a2cc… |
| v0.2.2 | 2026-07-02 | process, fs:read | — | 6bec03091ab4… |
| v0.2.1 | 2026-06-28 | process, fs:read | — | e50808398309… |
| v0.1.2 | 2026-06-28 | none | — | 5904ea8d96c3… |
| v0.1.1 | 2026-06-28 | none | — | 537f87ba4ed6… |